Custom View
Usage
The custom view allows to show arbitrary data using templates. This view is generally useful for creating readonly reports.
The custom view definition is:
<custom name="view-name" title="View Title">

  <!-- dataset fields (optional) -->
  <field name="some" type="integer" />
  <field name="total" type="decimal" scale="4"/>

  <!-- dataset is required -->
  <dataset type="jpql|sql|rpc">
  <![CDATA[
  // jpql or sql or method call
  ]]>
  </dataset>

  <!-- template is require -->
  <template>
  <![CDATA[
  // template, data can be accessed using `data`, and first data item
  // is accessible as `first`.
  ]]>
  </template>
</custom>
Example usage with a custom template:
<!-- Dashboard box with custom template -->
<custom name="report.total.sale" title="Total sale" css="report-box">
  <dataset type="jpql">
  <![CDATA[
  select sum(self.totalAmount) as total from Order self
  ]]>
  </dataset>
  <template>
  <![CDATA[
  <div class="report-data">
    <h1>{{first.total}}</h1>
    <small>Total sale</small>
    <div class="report-percent font-bold text-info pull-right">20% <i class="fa fa-level-up"></i></div>
    <div class="report-tags"><span class="label label-important">Monthly</span></div>
  </div>
  ]]>
  </template>
</custom>
The attributes are:
Attribute |
Description |
|
name of the view |
|
display title of the view |
The elements are:
Element |
Description |
|
field definitions for the dataset (optional, can be multiple) |
|
dataset definition |
|
a template |
Field
The <field> element can be used to provide metadata information about a dataset
item. This is the same as fields in grid view.
Built-in templates
Two template tags are built in:
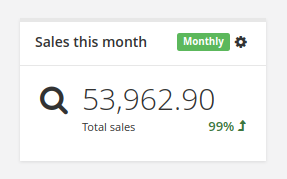
report-box
This template renders data as a small and simple report box (useful in dashboard).
Static attributes:
-
icon- icon name -
label- a label to describe the value
Dynamic expressions:
-
value- a number value in dataset -
percent- a percent value in dataset (formatted withpercentfilter) -
up- boolean expression for the up or down icon beside the percent value (or no icon if null) -
tag- a tag to show on title area of the box -
tag-css- CSS class to apply to tag
Example usage:
<!-- Sample custom view definition using report-box template -->
<custom name="report-box-sales-month" title="Sales this month">
  <dataset type="rpc">com.axelor.sale.web.SaleOrderController:reportMonthly</dataset>
  <template>
  <![CDATA[
  <report-box icon='fa-search' label='Total sales' value='first.total'
    percent='first.percent' up='first.up' tag='first.tag' tag-css='first.tagCss'/>
  ]]>
  </template>
</custom>
public class SaleOrderController {
public void reportMonthly(ActionRequest request, ActionResponse response) {
// ...
Map<String, Object> data = new HashMap<>();
data.put("total", total);
data.put("percent", percent);
data.put("up", total.compareTo(last) > 0);
data.put("tag", I18n.get("Monthly"));
data.put("tagCss", "label-success");
// This data will be put into dataset.
// For report-box, we send a list with a single item accessible as `first`.
response.setData(List.of(data));
}
}
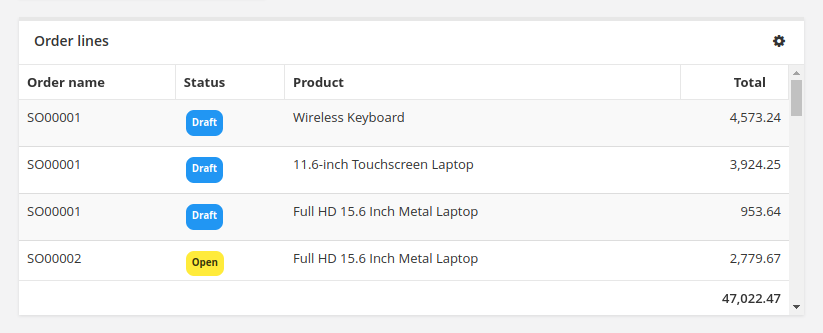
report-table
This template renders the dataset as a table. It uses field metadata for formatting and can use any widgets supported on grid view. It also supports sorting by columns.
Static attributes:
-
columns- comma-separated list of dataset fields as table columns (if not specified, uses keys from dataset items) -
sums- comma-separated list of dataset fields to show sums
Example usage:
<!-- Sample custom view definition using report-table template -->
<custom name="report-table-order-lines" title="Order lines">
  <field name="name" title="Order name"/>
  <field name="statusSelect" title="Status" type="integer"
    selection="selection-order-status" widget="single-select"/>
  <field name="productName" title="Product" type="string" x-translatable="true"/>
  <field name="total" type="decimal" x-scale="2"/>
  <dataset type="jpql" limit="40">
  <![CDATA[
  SELECT self.name AS name, self.statusSelect AS statusSelect,
    item.product.name as productName, item.quantity * item.price AS total
  FROM Order self
  JOIN self.items item
  ORDER BY self.name
  ]]>
  </dataset>
  <template>
  <![CDATA[
  <report-table sums='total'/>
  ]]>
  </template>
</custom>