Custom View
Usage
The custom view allows to show arbitrary data using templates. This view is generally useful for creating readonly reports.
The custom view definition is:
<custom name="view-name" title="View Title">

  <!-- dataset fields (optional) -->
  <field name="some" type="integer" />
  <field name="total" type="decimal" scale="4"/>

  <!-- dataset is required -->
  <dataset type="jpql|sql|rpc">
  <![CDATA[
  // jpql or sql or method call
  ]]>
  </dataset>

  <!-- template is require -->
  <template>
  <![CDATA[
  // angular.js template, data can be accessed using `data`, and first data item
  // is accessible as `first`.
  ]]>
  </template>
</custom>
Example usage with a custom template:
<!-- Dashboard box with custom template -->
<custom name="report.total.sale" title="Total sale" css="report-box">
  <dataset type="jpql">
  <![CDATA[
  select sum(self.totalAmount) as total from Order self
  ]]>
  </dataset>
  <template>
  <![CDATA[
  <div class="report-data">
    <h1>{{first.total}}</h1>
    <small>Total sale</small>
    <div class="report-percent font-bold text-info pull-right">20% <i class="fa fa-level-up"></i></div>
    <div class="report-tags"><span class="label label-important">Monthly</span></div>
  </div>
  ]]>
  </template>
</custom>
The attributes are:
Attribute |
Description |
|
name of the view |
|
display title of the view |
The elements are:
Element |
Description |
|
field definitions for the dataset (optional, can be multiple) |
|
dataset definition |
|
Field
The <field> element can be used to provide metadata information about a dataset
item. This is the same as fields in grid view.
DataSet
The <dataset> element is used to define a dataset.
-
type- dataset type (jpql,sqlorrpc) -
limit- query result limit (in case ofjpqlandsql)
Template
The <template> element is used to define an angular.js template
to render the data.
The dataset result is available as data and the first result of the data is
available as first.
Built-in templates
Two template tags are built in:
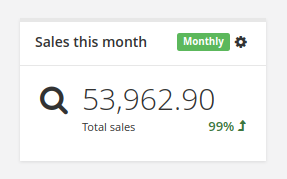
report-box
This template renders data as a small and simple report box (useful in dashboard).
Static attributes:
-
icon- Font Awesome icon name -
label- a label to describe the value
Dynamic expressions:
-
value- a number value in dataset -
percent- a percent value in dataset (formatted withpercentfilter) -
up- boolean expression for the up or down icon beside the percent value (or no icon if null) -
tag- a tag to show on title area of the box -
tag-css- CSS class to apply to tag
Example usage:
<!-- Sample custom view definition using report-box template -->
<custom name="report-box-sales-month" title="Sales this month">
  <dataset type="rpc">com.axelor.sale.web.SaleOrderController:reportMonthly</dataset>
  <template>
  <![CDATA[
  <report-box icon='fa-search' label='Total sales' value='first.total'
    percent='first.percent' up='first.up' tag='first.tag' tag-css='first.tagCss'/>
  ]]>
  </template>
</custom>
public class SaleOrderController {
public void reportMonthly(ActionRequest request, ActionResponse response) {
// ...
Map<String, Object> data = new HashMap<>();
data.put("total", total);
data.put("percent", percent);
data.put("up", total.compareTo(last) > 0);
data.put("tag", I18n.get("Monthly"));
data.put("tagCss", "label-success");
// This data will be put into dataset.
// For report-box, we send a list with a single item accessible as `first`.
response.setData(List.of(data));
}
}
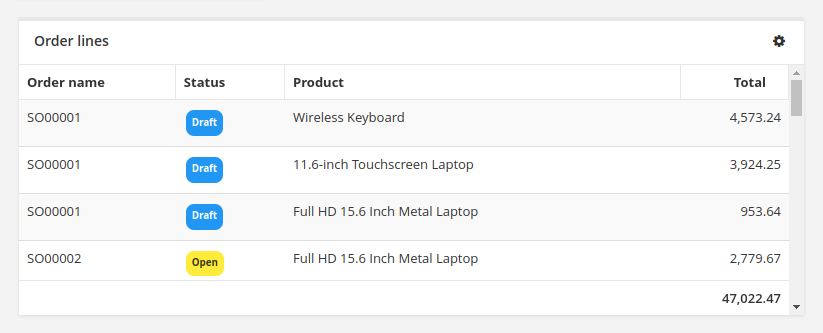
report-table
This template renders the dataset as a table. It uses field metadata for formatting and can use any widgets supported on grid view. It also supports sorting by columns.
Static attributes:
-
columns- comma-separated list of dataset fields as table columns (if not specified, uses keys from dataset items) -
sums- comma-separated list of dataset fields to show sums
Example usage:
<!-- Sample custom view definition using report-table template -->
<custom name="report-table-order-lines" title="Order lines">
  <field name="name" title="Order name"/>
  <field name="statusSelect" title="Status" type="integer"
    selection="selection-order-status" widget="single-select"/>
  <field name="productName" title="Product" type="string" x-translatable="true"/>
  <field name="total" type="decimal" x-scale="2"/>
  <dataset type="jpql" limit="40">
  <![CDATA[
  SELECT self.name AS name, self.statusSelect AS statusSelect,
    item.product.name as productName, item.quantity * item.price AS total
  FROM Order self
  JOIN self.items item
  ORDER BY self.name
  ]]>
  </dataset>
  <template>
  <![CDATA[
  <report-table sums='total'/>
  ]]>
  </template>
</custom>