BPM Dashboard
Introduction
The BPM Dashboard provides a centralized view for monitoring and managing BPM processes. It offers real-time charts and statistics about task assignments, process execution times, and completion metrics, giving managers and administrators visibility into the overall health of their business processes.
Dashboard Charts
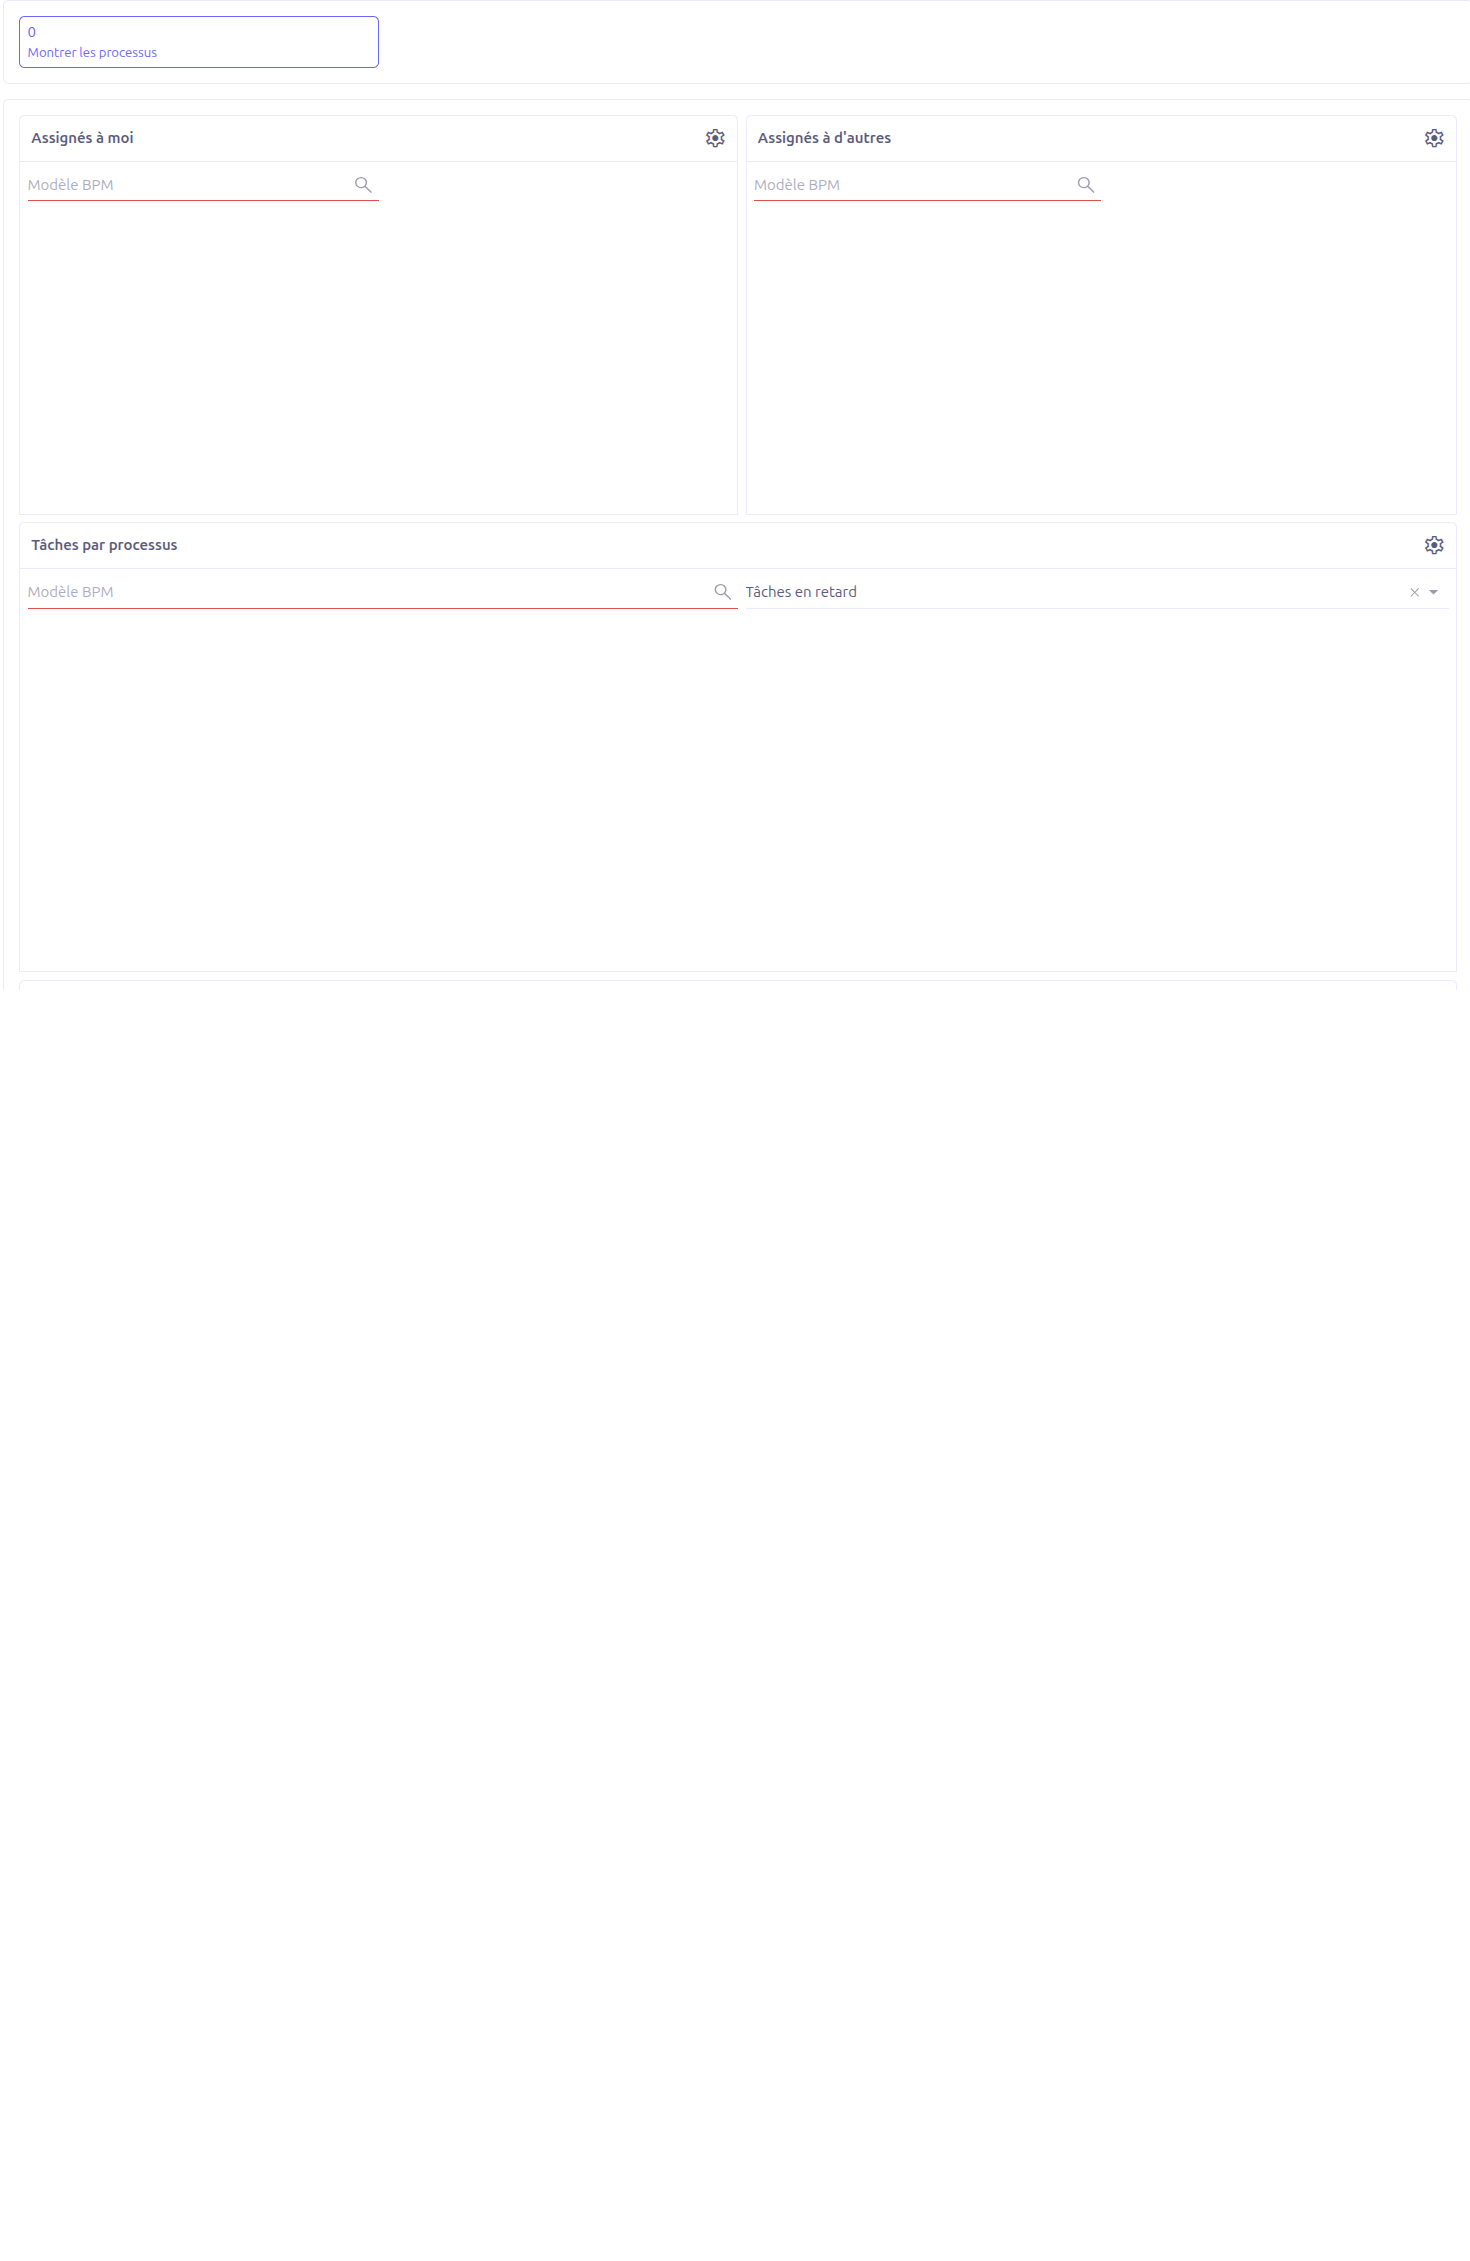
The main dashboard displays seven charts organized in panels. These charts query the Camunda history tables (act_hi_actinst, act_hi_procinst) to provide real-time process execution data.
Most charts include a BPM Model filter (wkfModel) that allows you to narrow down the data to a specific model. Additional filters vary by chart.
Assigned to Me (1)
Displays the tasks currently assigned to the logged-in user, grouped by process and status. This chart provides a quick overview of your personal workload.
-
Chart type: Donut
-
Data source:
chart.wkf.bpm.manager.assigned.me.tasks -
Filter: BPM Model
-
Visible to: All users
Assigned to Others (2)
Displays tasks assigned to other users, providing managers with an overview of team workload distribution.
-
Chart type: Donut
-
Data source:
chart.wkf.bpm.manager.assigned.other.tasks -
Filter: BPM Model
-
Visible to: SuperAdmin, Admin, and Manager roles only
| This chart is only visible to users with elevated roles (SuperAdmin, Admin, or Manager). Standard users will not see this section on the dashboard. |
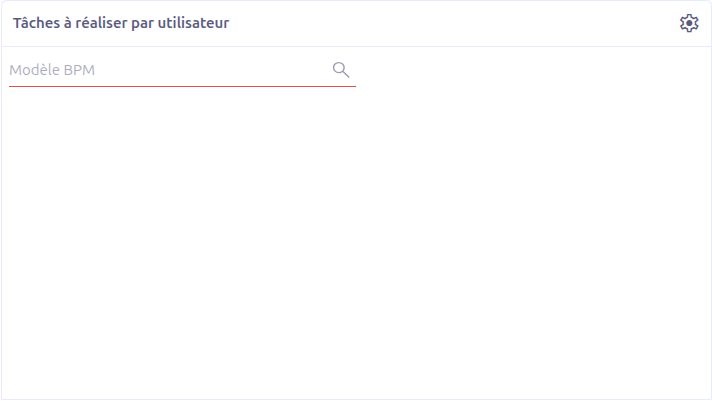
Tasks by Process (3)
A comprehensive chart displaying the distribution of tasks across all active processes. Helps identify which processes have the highest task volumes.
-
Chart type: Bar (grouped by model)
-
Data source:
chart.wkf.bpm.manager.task.by.process -
Filters: BPM Model, Type (Late tasks / Not late tasks)
-
Visible to: All users
Average Time Spent per Node by User (4)
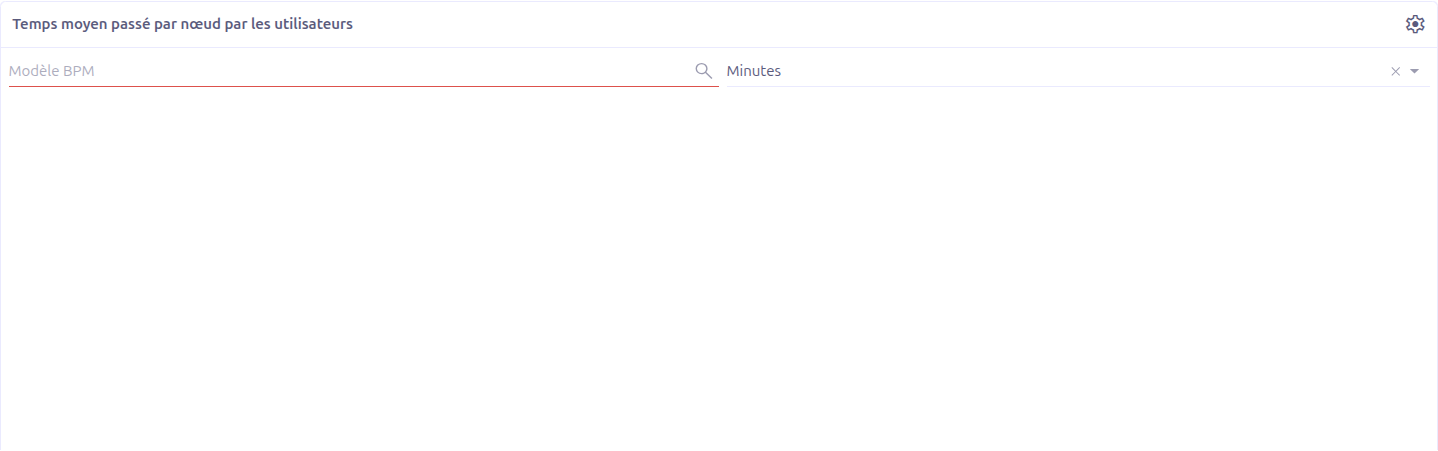
Shows the average time each user spends on each process node. This chart is essential for identifying bottlenecks and optimizing process efficiency.
-
Chart type: Horizontal bar (grouped by user)
-
Data source:
chart.wkf.bpm.manager.average.time.per.node.by.user -
Filters: BPM Model, Unit (Minutes / Hours / Days)
-
Visible to: All users
|
Use this chart to identify nodes where users spend disproportionate time. This may indicate unclear instructions, missing data, or process design issues that can be improved. |
Task Done Today per User (5)
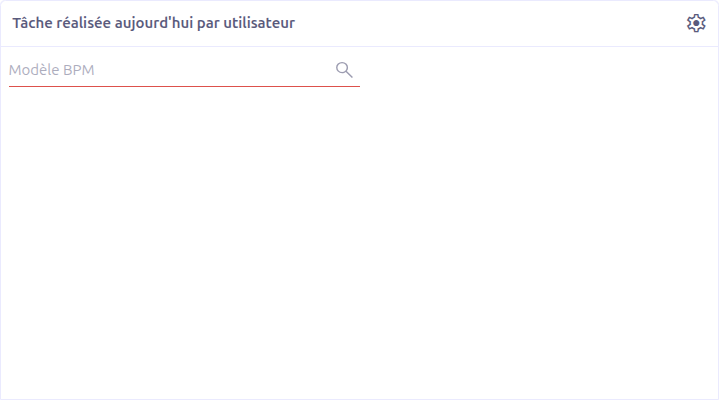
Displays the number of tasks completed today by each user. Provides a real-time view of daily productivity.
-
Chart type: Donut
-
Data source:
chart.wkf.bpm.manager.task.done.today.per.user -
Filter: BPM Model
-
Visible to: All users
Show Processes
The Show Processes button opens a detailed, paginated view of all deployed BPM processes.
Process List Content
Each process entry displays:
-
Model title (1): The BPM model name with a version tag badge
-
Processes (2): The processes defined within the model
-
Associated data models (3): Data models linked to the process, with record counts. These counts are clickable links that open a filtered view of the records.
-
Assigned to me (4): Tasks assigned to the current user, grouped by status. Status labels are clickable to filter the task list.
-
Assigned to others (5): Tasks assigned to other users, grouped by status. Only visible to administrators and managers.
| The "Assigned to others" column is only visible to users with SuperAdmin, Admin, or Manager roles. |
Workflow Model Dashboard
In addition to the main BPM Dashboard, each deployed BPM model has its own dashboard accessible from the model’s properties. See Model Dashboard for details.
Process Instance Dashboard
Each individual process instance also has its own dashboard. See Instance Dashboard for details.
Technical Details
Role-Based Access Control
The dashboard implements role-based visibility using the following logic:
| Role | Access Level | Visible Content |
|---|---|---|
SuperAdmin |
Full |
All 7 charts + "Assigned to others" in process list |
Admin |
Full |
All 7 charts + "Assigned to others" in process list |
Manager |
Full |
All 7 charts + "Assigned to others" in process list |
Standard User |
Limited |
6 charts (no "Assigned to others") + own tasks only in process list |
Backend Services
-
BpmManagerDashboardController— Handles chart data requests, process display, and pagination -
BpmManagerDashboardServiceImpl— Implements role-based access logic and data aggregation (FETCH_LIMIT = 20) -
BpmManagerDashboardUserService— Provides user-specific dashboard data -
BpmManagerDashboardTaskService— Provides task-specific dashboard data
Data Source
Dashboard charts query the Camunda process engine’s history tables:
-
act_hi_actinst— Historical activity instances (completed and active tasks) -
act_hi_procinst— Historical process instances (started, completed, terminated)
| Charts require the Camunda engine to be running and historical data to be present. If the BPM app has just been installed with no processes deployed, the charts will be empty. |
Related Pages
-
Model Dashboard — Per-model workflow charts
-
Instance Dashboard — Per-instance execution charts
-
App BPM Configuration — BPM application settings
-
BPM Overview — Complete BPM feature overview